When Jennifer Gannon, space physicist lent her name to the May 2024 solar tempest, few could have guessed just how extreme it would become. From May 10 to May 13, a G5‑level geomagnetic storm slammed Earth, registering a historic Dst‑index low of –410 nT and a Kp of 9 – numbers not seen since the Halloween storms of 2003. NASA confirmed that the event, dubbed the “2024 Mother’s Day solar storm” and officially recorded as the Gannon stormEarth, produced a 30‑TEC‑unit plunge in vertical Total Electron Content (VTEC) on May 11, unsettling satellite links, GPS accuracy and power‑grid stability worldwide.
What Sparked the May Explosion?
The storm’s ferocious driver was a pair of solar active regions – AR3664 and AR3668 – that merged into a monstrous sunspot complex in early May. Between May 8 and May 14, the duo unleashed eleven X‑class flares, including an X8.7 flare on May 14 that topped the current solar cycle’s output. NASA’s Solar Dynamics Observatory captured 82 notable flares from May 3‑9 alone, while the powerful coronal mass ejections (CMEs) they hurled toward the solar system raced at speeds up to 3 million mph (≈ 1 340 km/s).
Crucially, the Wang‑Sheeley‑Arge–ENLIL+Cone model showed that a fast CME linked to the May 9 X2.2 flare overtook slower predecessors, arriving at 1 AU in a tightly packed sheath on May 10. This CME‑CME interaction amplified magnetic field strength and prolonged the geomagnetic disturbance.
How the Ionosphere Reacted
During the main phase on May 11, ground‑based ionosondes across 37 stations recorded a stark negative storm effect: VTEC values dropped by roughly 30 TEC units, especially at low‑ and equatorial latitudes. The depleted electron density weakened the ionospheric conductivity, curtailing the equatorial electrojet and reducing the horizontal magnetic field observed on the surface.
Scientists attribute the TEC dip to a cocktail of processes – rapid recombination of ions, plasma instabilities, altered neutral winds, and the overall disruption of daytime photoionization. The storm also ushered in an S1 solar radiation event that briefly peaked at S2, adding another layer of complexity for models that predict space‑weather impacts on navigation and communication systems.
Voices from the Frontlines
"We'll be studying this event for years. It will help us test the limits of our models and understanding of solar storms," said Teresa Nieves‑Chinchilla, Acting Director of NASA's Moon to Mars (M2M) Space Weather Analysis Office. Her remarks echo a broader sentiment among space‑weather forecasters.
Dr. James Mason, senior scientist at the NOAA Space Weather Prediction Center, added, "The Gannon storm forced us to revise our warning thresholds. Satellite operators reported brief outages, and airlines rerouted polar flights to avoid increased radiation exposure. It's a wake‑up call for infrastructure resilience."
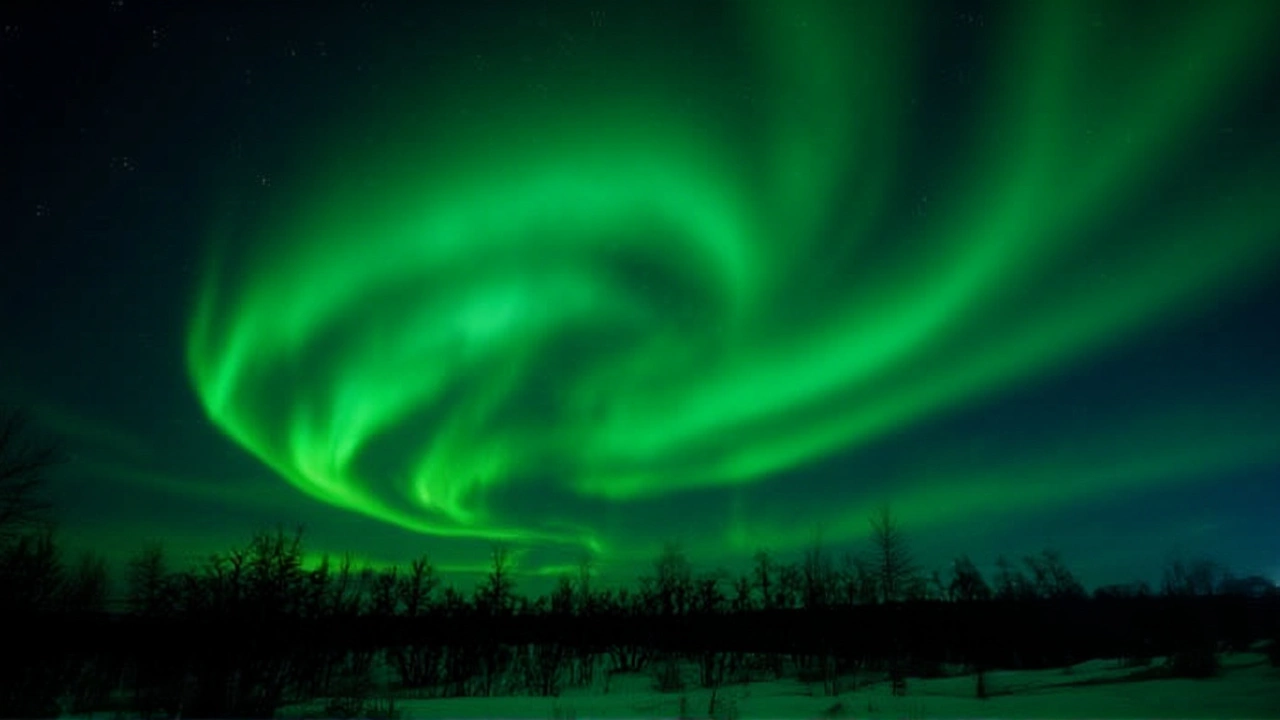
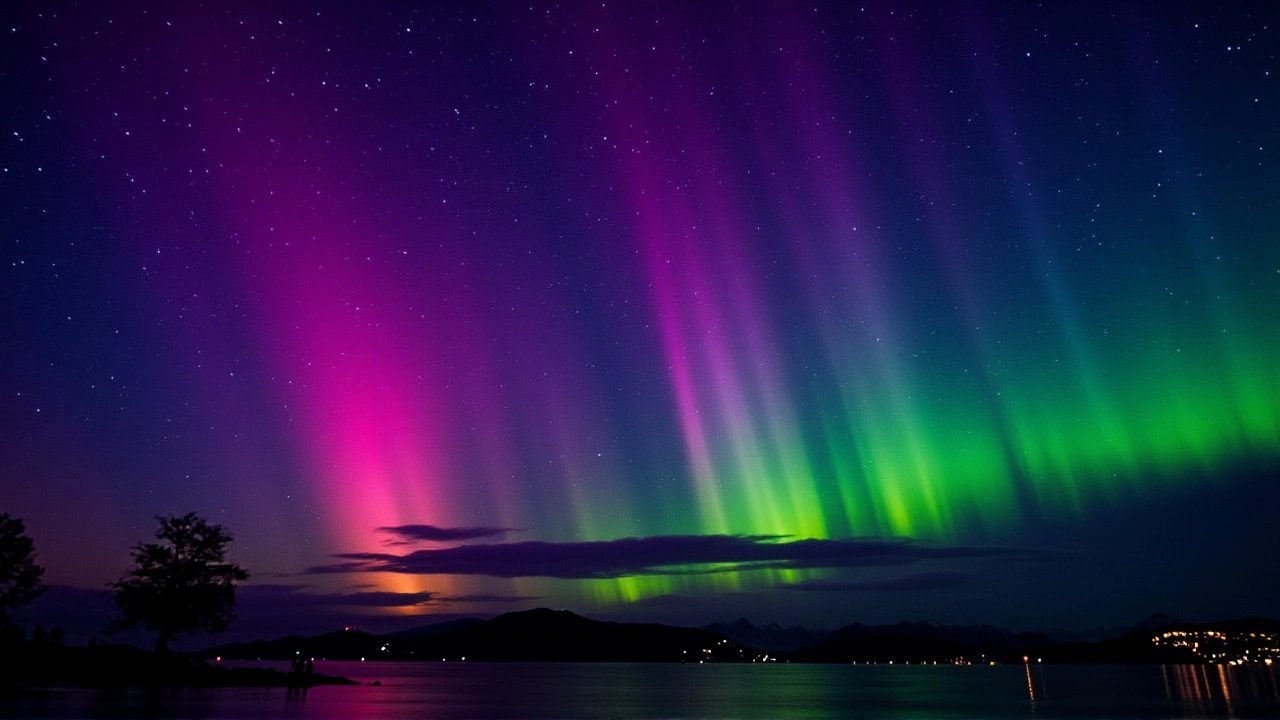
A network of amateur aurora chasers in Texas, northern Mexico, and even central Brazil posted photos of vivid curtains stretching as far south as latitude 30° N, a rarity only seen during the most severe storms of the past few decades.
Why It Matters Beyond the Lights
The ionospheric punch‑down has direct repercussions for GNSS accuracy: navigation receivers saw positioning errors spike to 15 meters in equatorial regions, temporarily degrading the reliability of maritime and aviation guidance. Power‑grid operators in the United Kingdom and parts of the United States reported heightened geomagnetically induced currents (GICs) that, while not causing blackouts this time, prompted precautionary load shedding.
From a scientific standpoint, the event furnishes an unprecedented data set. The synchronized arrival of multiple CMEs allowed researchers to isolate the effects of CME‑CME interaction on magnetic field amplification. Coupled with the dense ionosonde coverage, the storm offers a real‑world laboratory for testing the latest global ionospheric models, such as the Thermosphere‑Ionosphere‑Electron system (TIE‑GCM).
Looking Ahead: Forecasts and Preparedness
Solar Cycle 25 is now in its rising phase, and early predictions suggest a higher frequency of X‑class flares in the coming years. Agencies are already budgeting for expanded ground‑based sensor arrays and next‑generation space‑borne imagers to close the data latency gap that hampered real‑time alerts during the May storm.
Meanwhile, industries poised at the front of space‑weather risk management – from satellite constellations to high‑frequency trading firms – are revisiting their contingency protocols. The consensus is clear: the Gannon storm proved that “extreme but not unimaginable” should become a new baseline for resilience planning.
Historical Context: From 1989 to 2003 and Beyond
The March 1989 storm, which knocked out Quebec's power grid, recorded a Dst of –589 nT, still the deepest on record. The Halloween storms of 2003 pushed Kp to 9 for several days, spawning spectacular aurorae and multiple satellite anomalies. The May 2024 event, while not surpassing the 1989 Dst dip, tied the 2003 Kp peak and exceeded all geomagnetic activity recorded since then, making it a benchmark for the current solar era.
- Dst minimum: –410 nT (vs –589 nT in 1989)
- Kp index: 9 (matched 2003)
- VTEC reduction: ~30 TEC units
- Number of X‑class flares: 11 (May 8‑14)
- CMEs speed: up to 3 million mph

Frequently Asked Questions
How did the storm affect GPS navigation?
During the storm’s peak, ionospheric irregularities caused positioning errors of up to 15 meters in equatorial regions. Aviation and maritime services temporarily switched to backup inertial navigation, highlighting the need for real‑time ionospheric monitoring.
What made the Gannon storm more severe than typical G5 events?
The storm resulted from a fast CME catching up with slower ones, creating a dense magnetic cloud that hit Earth. This CME‑CME interaction amplified the interplanetary magnetic field, driving the record Dst plunge and widespread ionospheric depletion.
Which regions saw the most dramatic aurora displays?
Aurorae were observed as far south as Texas, northern Mexico, and even parts of Brazil (≈ 30° N). In the Southern Hemisphere, observers in Patagonia reported bright curtains extending to 35° S, a latitude rarely illuminated outside of extreme storms.
What are the implications for future satellite operations?
The ionospheric blackout increased signal scintillation, leading to temporary loss of lock for low‑Earth orbit satellites. Operators are now prioritising hardening of transceiver electronics and integrating space‑weather alerts into autonomous safety protocols.
How does this event shape our understanding of solar cycle 25?
The rapid succession of X‑class flares suggests Solar Cycle 25 may peak earlier and more intensely than earlier forecasts. Researchers will use the storm’s data to refine solar dynamo models and improve long‑term space‑weather forecasting.


